Rpi scoop and afe intake..

tertius said:
Some simple comparisons make your data difficult to accept, for example using the BMEP figure I calculated earlier (15.5 bar), means that your engine is doing a better job than a 2006 Formula One V8 at peak power (2.4L, 750 bhp at 18500 rpm) with a BMEP of 15.1 Bar.

Tertius, I've been doing a bit of searching for some published data and discovered that the Carfolio website gives the published BMEP figures.

If you look up the data for the Z4MC as found here:http://www.carfolio.com/specifications/models/car/?car=137973 You will see that the BMEP is 204.9psi and if we now look up the BMEP for the Honda S2000 here: http://www.carfolio.com/specifications/models/car/?car=116732 you'll see it's 185.9 psi

If we now convert those two figures to Bar, using the converter here: http://www.convertunits.com/from/psi/to/bar I suggest that the second converter is the correct one to use. Therefore the Z4MC has a BMEP of 15.14Bar and the Honda S2000 has a BMEP of 13.83Bar. Therefore, an OEM Z4MC actually achieves a similar figure to a F1 engine and that's just my starting point!

I've already said that the published Volumetric Efficiency of the S54 engine is 105% and the Honda S2000 is 115%, and it is a fact that increasing VE improves performance, therefore, it follows, that if I've been able to increase VE above 105%, as my datalogging has shown, then have I not also been able to increase the BMEP above the OEM figure?

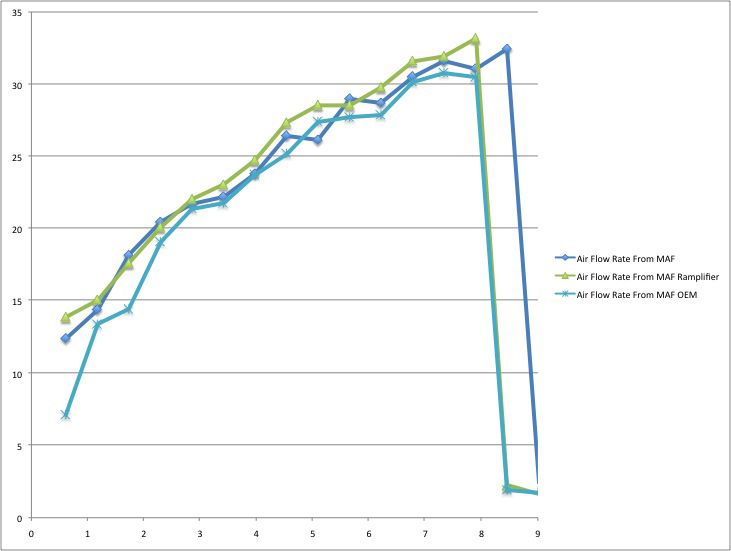
Since you think that my DashDyno might produce bogus dyno results, take a look at the graph below that I've previously posted in this thread. This data is simply the ECU's recording of airflow through the MAF, that requires absolutely no further computation. As you can see, I've been able to increase the maximum airflow from around 31 lbs/min (OEM) to over 33 lbs/min with my ramcharger mod. Since increasing airflow gives a higher VE figure, then I would suggest that I have been able to exceed the BMEP of a F1 engine with my Z4MC. Do you agree?

FYI, a M3 CSL has a BMEP of 15.34Bar

AirflowcomparisonsZ4MC.jpg
 
I'm sorry I have to actually work today so don't have time to reply properly but I think we are mixing up BMEP at peak torque and BMEP at peak power.

Normally BMEP is calculated at peak torque, which for a normal engine is at much lower revs than peak power and the BMEP value will be higher than at peak power.

The 15.1 BAR number for the standard Z4MC engine is the peak torque value at 4,900 rpm.

Your 15.5 number is at peak power. A quick calculation gives me a value of 11.8 for the standard S54 at peak power.

So improving from 11.8 to 15.5 at peak power is an improvement of over 30%.
 
Tertius,

If we consider the step in the plots of torque/hp above 7000rpm in my comparison graph as an artefact, (the reason for which it occurs, I've already explained) and consider the three different plots for torque, then we have the following "at the wheels" figures:
Stock = 231.06 ft/lbs at 4800rpm
Modified air intake and silencers = 237.59 ft/lbs at 6100rpm
Ram charger with OEM silencers = 246 ft/lbs at 5400rpm

The published Maximum Torque for the Z4MC is 269 ft/lbs at 4900, and so if we deduct 15% for losses, that gives a figure of 228.65 ft/lbs. If we compare that figure produced by my DashDyno of 231.06 ft/lbs, there's only a difference of 2.41 ft/lbs, which is within 1.05% of the published figure. In my book, that's pretty damned close to the published torque figure! Wouldn't you agree?

So, if my methodology is always the same, then I'm always comparing apples with apples and the three plots on my graph are comparable. I would find it hard to understand how anyone could consider my baseline of the stock car is anything other than very accurate; so what would be the basis for challenging the accuracy and validity of any of the other figures produced by the same procedure?

From my comparison graph, the Maximum Torque figures would be:
Modified air intake and silencers = 237.59 ft/lbs at 6100rpm which is an increase in torque from stock of 2.83% ( add 17.647% = 15% loss) gives "at the flywheel" of 279.5 ft/lbs
Ram charger with OEM silencers = 246 ft/lbs at 5400rpm which is an increase in torque from stock of 6.46% ( add 17.647% = 15% loss) gives "at the flywheel" of 289.4 ft/lbs

Using the above "at the flywheel" calculated figures, for the air-intake/exhaust mods I get a BMEP of 212.78psi = 15.68 Bar, and for the ramcharger mod I get a BMEP of 220.32psi =16.20 Bar. Since, as you say, the BMEP at Peak Torque is a published 15.14 Bar, then I am seeing an increase of just 7% with my ramcharger mod and not the 30% you've been calculating.

The increase in BMEP of 7% is very similar to the increase in airflow I've been able to achieve, as shown in my graph above, which suggests to me, that all my figures do actually tie up.


.
 
exdos said:
Tertius,

If we consider the step in the plots of torque/hp above 7000rpm in my comparison graph as an artefact, (the reason for which it occurs, I've already explained) and consider the three different plots for torque, then we have the following "at the wheels" figures:
Stock = 231.06 ft/lbs at 4800rpm
Modified air intake and silencers = 237.59 ft/lbs at 6100rpm
Ram charger with OEM silencers = 246 ft/lbs at 5400rpm

The published Maximum Torque for the Z4MC is 269 ft/lbs at 4900, and so if we deduct 15% for losses, that gives a figure of 228.65 ft/lbs. If we compare that figure produced by my DashDyno of 231.06 ft/lbs, there's only a difference of 2.41 ft/lbs, which is within 1.05% of the published figure. In my book, that's pretty damned close to the published torque figure! Wouldn't you agree?

I do agree that they are very close, but

a) I would much prefer to have a measured value for transmission losses rather than a guess; and

b) From reading around it seems to be quite unusual for a standard S54 in a Z4M to actually meet or exceed the manufacturer figure, so you may have an exceptional engine or your method may be producing over-optimistic values

exdos said:
So, if my methodology is always the same, then I'm always comparing apples with apples and the three plots on my graph are comparable. I would find it hard to understand how anyone could consider my baseline of the stock car is anything other than very accurate; so what would be the basis for challenging the accuracy and validity of any of the other figures produced by the same procedure?

I agree that you methodology is consistent, and (subject to some comments below) we are comparing apples with apples.

The basis for challenge is simply that the results you are claiming are extraordinary and you seem unwilling to perform some more traditional/independent tests.

Additionally if we compare your “OEM” torque curve with other examples (e.g. here http://www.dyno-plot.co.uk/dyno/dynoplot/id%3D786%26but_sea%3Dqs%26frcd%3D161/BMW-Z4M.htm) you will see that your torques curve is unusually flat compared with the dyno-plot graph which drops off noticeably after the peak torque value. Now a flat torque is good, very good, but that difference does make me wonder if there is something odd about the way Dashdyno is estimating torque?

exdos said:
From my comparison graph, the Maximum Torque figures would be:
Modified air intake and silencers = 237.59 ft/lbs at 6100rpm which is an increase in torque from stock of 2.83% ( add 17.647% = 15% loss) gives "at the flywheel" of 279.5 ft/lbs
Ram charger with OEM silencers = 246 ft/lbs at 5400rpm which is an increase in torque from stock of 6.46% ( add 17.647% = 15% loss) gives "at the flywheel" of 289.4 ft/lbs

Using the above "at the flywheel" calculated figures, for the air-intake/exhaust mods I get a BMEP of 212.78psi = 15.68 Bar, and for the ramcharger mod I get a BMEP of 220.32psi =16.20 Bar. Since, as you say, the BMEP at Peak Torque is a published 15.14 Bar, then I am seeing an increase of just 7% with my ramcharger mod and not the 30% you've been calculating.
The increase in BMEP of 7% is very similar to the increase in airflow I've been able to achieve, as shown in my graph above, which suggests to me, that all my figures do actually tie up.

You are bouncing around the chart and picking numbers at different RPMs and then comparing them. Remember we are trying to compare the same fundamental engine here so in order to really see what the differences are we should try to compare at similar points iin the rev range.

My 30% increase came from comparing the stock engine at peak power - 7900 rpm; with a BMEP of 11.8 - to your engine at peak power - in your case 7800 rpm, i.e an almost identical engine speed, a BMEP of 15.8 (over 33% greater).

So not only have you increased peak torque value above the standard engine, you have kept the curve flat almost throughout the rev range AND shifted the point at which peak torque is made up the rev range, thus increasing the power output of the engine massively. And you did all this by just modifying the air intake.

Just for a rough comparison, Manthey Motors (who are admittedly extraordinarily expensive) charge c. 9000 euros (plus VAT) to add 30 BHP (just under an 8% increase) to gen 2 996 GT3, and need a full exhaust system (right from the manifold back), to re-program the ECU and to update air filter/intake to do it. By contrast your air intake work alone has increased peak power by nearly 27%!
 
tertius said:
I do agree that they are very close, but

a) I would much prefer to have a measured value for transmission losses rather than a guess;
Take a look at the thread comparing the S54 to the S65 here: http://www.bimmerboost.com/showthre...erview-history-comparison-and-power-potential the author states: “You may notice both motors follow the 15% drivetrain loss rule almost exactly.” Why should my Z4MC with the same S54 engine be much different?

tertius said:
b) From reading around it seems to be quite unusual for a standard S54 in a Z4M to actually meet or exceed the manufacturer figure, so you may have an exceptional engine or your method may be producing over-optimistic values
Au contraire. From my reading, it seems that BMW has managed to produce the S54 to very close tolerances and they all record very similar dyno figures to the published values for each different model the S54 engine is used. Only a few postings ago, Original Guvnor posted: “mine has recently been static dyno'd at 321bhp at 7300 rpm so I'd guess it will be near enough stock at 7900. It is also completely unmodified from factory as well.” Again, why should my Z4MC be much different?


tertius said:
I agree that you methodology is consistent, and (subject to some comments below) we are comparing apples with apples.

I’m glad you accept that my method is consistent. As I’ve always said; even if my DashDyno figures are not calibrated against a static dyno, that doesn’t actually matter at this stage. All I require to make progress with my R&D is a reliable and consistent method, which will show me gains or losses compared to my DashDyno recording of my Z4MC in OEM state to point me in the right direction. The information that I’m collecting is all relative to the same car and the same method.

tertius said:
The basis for challenge is simply that the results you are claiming are extraordinary and you seem unwilling to perform some more traditional/independent tests.
I will be more than happy to do such tests when I consider the time is right, and that’s when I’ve taken this project as far as I think it can be taken and I'm ready to patent or publish, and I’m not finished yet. As I’ve previously reported: “I've been in arguments/discussion in the past about the effectiveness of the ram-effect and originally got into datalogging to find out for myself what is actually happening inside the air-intake system. Some folk demand the proof and if you don't provide it, then you're damned, and when you do produce it, you're damned again.” It seems to becoming the case in this instance. Are you happy to pay all my costs for the tests you suggest?

tertius said:
Additionally if we compare your “OEM” torque curve with other examples (e.g. here http://www.dyno-plot.co.uk/dyno/dynoplot/id%3D786%26but_sea%3Dqs%26frcd%3D161/BMW-Z4M.htm) you will see that your torques curve is unusually flat compared with the dyno-plot graph which drops off noticeably after the peak torque value. Now a flat torque is good, very good, but that difference does make me wonder if there is something odd about the way Dashdyno is estimating torque?

The reason why my DashDyno produces a flattish torque curve, is precisely the same reason I keep hammering the point that a static dyno cannot replicate the ram-effect. My DashDyno would produce the same flattish torque curve when hooked up to ALL Z4MCs being logged in real world conditions, where ram effect occurs, and not just mine. As I’ve said before, a 3rd gear run goes to speeds well above the speed of the fan used with most static dynos, consequently there is air-starvation of the Z4MC's OEM ram-intake on a dyno. In “real world” conditions the Z4MC OEM air-intake harnesses the ram effect, which maintains torque levels as does the Vanos system. Do you get how ram-intakes are supposed to work now?

tertius said:
You are bouncing around the chart and picking numbers at different RPMs and then comparing them. Remember we are trying to compare the same fundamental engine here so in order to really see what the differences are we should try to compare at similar points iin the rev range.
I’m not bouncing around the chart at all; I’m simply quoting the actual maximum torque values at their respective rpms (ignoring the so-called “artefact”). I don't decide the rpms at which peak torque occurs, I've simply looked at the data and stated the rpm at which the highest torque value has occurred. Are you disputing those values? Look at the graph again and you should be able to see precisely those points on the three plots. If you don’t agree with the figures I’ve used, please can you tell me the values we should use?

tertius said:
My 30% increase came from comparing the stock engine at peak power - 7900 rpm; with a BMEP of 11.8 - to your engine at peak power - in your case 7800 rpm, i.e an almost identical engine speed, a BMEP of 15.8 (over 33% greater).

You explained that in your last post, so that's why I performed the calculations using BMEP at peak torque, and now I’ve demonstrated that the increase is 7%, and not 30% as you suggest. Now that I've worked to your method, you don't seem to like this by now claiming I’m “bouncing around the chart”, although you have conceded that my methodology is consistent. As I see this is another case of “Some folk demand the proof and if you don't provide it, then you're damned, and when you do produce it, you're damned again”. Déjà vu. :thumbsdown:

tertius said:
So not only have you increased peak torque value above the standard engine, you have kept the curve flat almost throughout the rev range AND shifted the point at which peak torque is made up the rev range, thus increasing the power output of the engine massively. And you did all this by just modifying the air intake.
Yes, but there’s a bit more to it than that. I could very easily tell you what I do, and then you’d easily see how this works, but because I’m still considering patenting my invention, I’m not willing to publicly divulge this information just yet, as I stated at the outset of this thread.

tertius said:
Just for a rough comparison, Manthey Motors (who are admittedly extraordinarily expensive) charge c. 9000 euros (plus VAT) to add 30 BHP (just under an 8% increase) to gen 2 996 GT3, and need a full exhaust system (right from the manifold back), to re-program the ECU and to update air filter/intake to do it.
My attitude has always been why pay that kind of money when a few simple air-intake mods and gutting the OEM silencers can work with the ECU without a remap, as I’ve publicly documented for my Z3MC elsewhere. Necessity is the mother of invention.

Someone once said that inventing is 99% perspiration and 1% inspiration. If you look at the history of development of almost any technology it’s mostly all evolution of what has gone before, where things move one step at a time. I have a great interest in lots of different things and my moment of 1% inspiration has been through making a connection between two other completely different things which, on the face of it, have no connection whatsoever to cars, but appeared to me in my thoughts to have some tenuous overlap. I simply couldn’t buy those thoughts.

tertius said:
By contrast your air intake work alone has increased peak power by nearly 27%!
I’ve explained previously how the spike in torque occurred in my ramcharger run, and the HP figure is solely a consequence of that. If you can find me any proper technical information about ram-intakes with lots of published data, I’d be obliged if you’d refer me to it. As it is, I consider that I'm in "unknown territory" but if you have better information to guide me, it would be most helpful. :thumbsup:

FYI, the BMW E87 I M has a published BMEP of 305.9psi = 22.1Bar so even with my ramcharger mod, I’m well away from mechanical forced induction figures with a BMW engine, so to me at least, my figures are realistic. <EDIT> A quick back of a fag packet calculation shows me that for my Z4MC to be able to achieve a BMEP of 22.1Bar, the MAF would have to record an airflow in the order of 48.5lbs/min, whereas, the highest figure I've seen to date is 33.4lbs/min. The absolute highest that I expect to see from a ram-intake is 35lbs/min with a rev limit set at OEM 8000rpm
 
Just a point of reference, the stock European Z4M has a BMW quoted maximum torque of 365Nm (269lbft) and an engine capacity of 3246cc. The BMEP is: torque * 4 * pi / displacement. Leading to a BMEP of 14.13 bar (204.9 psi) at peak torque.

The North American car only has 355Nm of peak torque, so it's BMEP is 13.74 bar (199.3 psi).

Also, at maximum power of 252kW at 7,900RPM, torque is 304.6Nm, BMEP is 11.79 bar (11.51 bar for North American vehicle).
 
aerobod said:
Just a point of reference, the stock European Z4M has a BMW quoted maximum torque of 365Nm (269lbft) and an engine capacity of 3246cc. The BMEP is: torque * 4 * pi / displacement. Leading to a BMEP of 14.13 bar (204.9 psi) at peak torque.

The North American car only has 355Nm of peak torque, so it's BMEP is 13.74 bar (199.3 psi).

Also, at maximum power of 252kW at 7,900RPM, torque is 304.6Nm, BMEP is 11.79 bar (11.51 bar for North American vehicle).


There are several different formulae for BMEP. This is the one that I used as found here: http://www.dgset.com/index.php?page=basic-formula

BMEP(psi) = 150.8 x Torque (lb-ft)/Displacement (cubic inches), where the S54's 3.246L displacement is 198.08307cu. inches

So for my car in OEM, my DashDyno recorded Torque at the wheels of 231.06 Ft/lbs. To account for 15% losses, I've added 17.647% to that figure which gives a "at the flywheel" figure of 271.83 Ft/lbs.

Using the above formula, we have (150.8 x 271.83) / 198.083 = 206.94 psi
To convert that figure to BMEP in Bar using the second converter here: http://www.convertunits.com/from/psi/to/bar so the figure is in absolute gauge pressure, we get 15.28 Bar

All my figures have been calculated in previous postings have used this method. Let's stick to one method otherwise this all just gets nit picky and detracts from the basic discussion. :thumbsup: .
 
Woots said:
All I asked is what colour should I paint my air box lol.....

Woots, I'm so sorry this has detracted from your original posting. and has become a complete "thread hijack". :oops:

Black. :thumbsup:
 
exdos said:
Woots said:
All I asked is what colour should I paint my air box lol.....

Woots, I'm so sorry this has detracted from your original posting. and has become a complete "thread hijack".

Black. :thumbsup:

Haha it's a bloody good job I went for black isn't it :) and it's ok, this thread has been largely quite interesting.....
 
Woots said:
exdos said:
Woots said:
All I asked is what colour should I paint my air box lol.....

Woots, I'm so sorry this has detracted from your original posting. and has become a complete "thread hijack".

Black. :thumbsup:

Haha it's a bloody good job I went for black isn't it :) and it's ok, this thread has been largely quite interesting.....


Do you want the formula of how I reached the conclusion as being "black"? :rofl:
 
exdos said:
Do you want the formula of how I reached the conclusion as being "black"? :rofl:

Can we have charts and logs too? :D

It has been entertaining and actually enlightening. It's going to be interesting meeting some of you guys at the Silverstone Classic this year (assuming you're going)
 
Stuart Truman said:
Can we have charts and logs too? :D
Of course and in colour

Stuart Truman said:
It has been entertaining and actually enlightening. It's going to be interesting meeting some of you guys at the Silverstone Classic this year (assuming you're going)
I'll be there again. :thumbsup:
 
mad4slalom said:
why would it perform differently in wisconsin than dakota or idaho ?...... :tumbleweed: :exitright: :rofl:

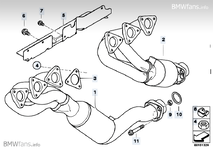
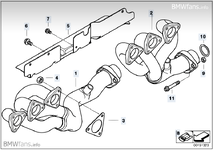
I'm assuming this is a serious question asking the difference between the US and Euro spec Z4Ms? If so, it's because the Americans have tighter emissions standards and for the American Z4Ms they place an extra set of cats closer to the engine as part of the exhaust manifolds, and this reduces torque/bhp.

American exhaust manifolds as below.

MTUxMzI4X3A=.png


European exhaust manifolds as below.

MTUxMzIzX3A=.png
 
exdos said:
aerobod said:
Just a point of reference, the stock European Z4M has a BMW quoted maximum torque of 365Nm (269lbft) and an engine capacity of 3246cc. The BMEP is: torque * 4 * pi / displacement. Leading to a BMEP of 14.13 bar (204.9 psi) at peak torque.

The North American car only has 355Nm of peak torque, so it's BMEP is 13.74 bar (199.3 psi).

Also, at maximum power of 252kW at 7,900RPM, torque is 304.6Nm, BMEP is 11.79 bar (11.51 bar for North American vehicle).


There are several different formulae for BMEP. This is the one that I used as found here: http://www.dgset.com/index.php?page=basic-formula

BMEP(psi) = 150.8 x Torque (lb-ft)/Displacement (cubic inches), where the S54's 3.246L displacement is 198.08307cu. inches

So for my car in OEM, my DashDyno recorded Torque at the wheels of 231.06 Ft/lbs. To account for 15% losses, I've added 17.647% to that figure which gives a "at the flywheel" figure of 271.83 Ft/lbs.

Using the above formula, we have (150.8 x 271.83) / 198.083 = 206.94 psi
To convert that figure to BMEP in Bar using the second converter here: http://www.convertunits.com/from/psi/to/bar so the figure is in absolute gauge pressure, we get 15.28 Bar

All my figures have been calculated in previous postings have used this method. Let's stick to one method otherwise this all just gets nit picky and detracts from the basic discussion. :thumbsup: .
There is only one formula for BMEP for a 4-stroke Otto-cycle engine (BMEP = 4π * Torque / Displacement), but depending on the units you use, different conversion factors may be needed. In SI units (Pressure in Pascals, Torque in Newton-metres, displacement in cubic metres) no conversion factors are required, any other units require a conversion factor (12 for the units you used (psi, cu in & lb ft) which when multiplied by 4π equals 150.80; 10 for bar, cc and Nm; none for psi, cu in & lb in). The accuracy of measurement and conversion may vary, but the formula is always the same.

You may have a strong car from a stock perspective, or the measurement method used may be inaccurate, but from a BMW specification perspective, a Z4M with a stock peak torque of 365Nm and an engine capacity of 3246cc must have a BMEP of 14.13 bar / 1413039 Pascals / 204.9 psi by definition. If the stock peak torque is different than BMW specifies, then of course the BMEP will be different.
 
aerobod said:
There is only one formul

a for BMEP for a 4-stroke Otto-cycle engine (BMEP = 4π * Torque / Displacement), but depending on the units you use, different conversion factors may be needed. In SI units (Pressure in Pascals, Torque in Newton-metres, displacement in cubic metres) no conversion factors are required, any other units require a conversion factor (12 for the units you used (psi, cu in & lb ft) which when multiplied by 4π equals 150.80; 10 for bar, cc and Nm; none for psi, cu in & lb in). The accuracy of measurement and conversion may vary, but the formula is always the same.

You may have a strong car from a stock perspective, or the measurement method used may be inaccurate, but from a BMW specification perspective, a Z4M with a stock peak torque of 365Nm and an engine capacity of 3246cc must have a BMEP of 14.13 bar / 1413039 Pascals / 204.9 psi by definition. If the stock peak torque is different than BMW specifies, then of course the BMEP will be different.

Aerobod,

You've mentioned the number 150.8 which is also included the calculation I gave as below:
BMEP(psi) = 150.8 x Torque (lb-ft)/Displacement (cubic inches), where the S54's 3.246L displacement is 198.08307cu. inches
Since the S54's displacement is a constant, the only variable in my formula is the Torque figure (ft/lbs). If we use the published torque of 269 ft/lbs in the above formula (which is = 365Nm as you've given) then we've got:

(150.8 x 269) / 198.083 = 204.78 psi, which is the same as the published BMEP found here: http://www.carfolio.com/specifications/models/car/?car=137973

To convert that figure from psi to Bar, I've used one of the two converters found here: http://www.convertunits.com/from/psig/to/bar
Therefore, it appears that the only difference between our figures is that you have used the first converter to achieve your figure of 14.13 Bar, whereas I've used the second to achieve a figure of 15.13Bar. It seems that difference between us is that you have used a differential scale of pressure, whereas I've used an absolute scale of pressure. Why have you used the differential scale and not the absolute scale?
 
exdos said:
aerobod said:
There is only one formul

a for BMEP for a 4-stroke Otto-cycle engine (BMEP = 4π * Torque / Displacement), but depending on the units you use, different conversion factors may be needed. In SI units (Pressure in Pascals, Torque in Newton-metres, displacement in cubic metres) no conversion factors are required, any other units require a conversion factor (12 for the units you used (psi, cu in & lb ft) which when multiplied by 4π equals 150.80; 10 for bar, cc and Nm; none for psi, cu in & lb in). The accuracy of measurement and conversion may vary, but the formula is always the same.

You may have a strong car from a stock perspective, or the measurement method used may be inaccurate, but from a BMW specification perspective, a Z4M with a stock peak torque of 365Nm and an engine capacity of 3246cc must have a BMEP of 14.13 bar / 1413039 Pascals / 204.9 psi by definition. If the stock peak torque is different than BMW specifies, then of course the BMEP will be different.

Aerobod,

You've mentioned the number 150.8 which is also included the calculation I gave as below:
BMEP(psi) = 150.8 x Torque (lb-ft)/Displacement (cubic inches), where the S54's 3.246L displacement is 198.08307cu. inches
Since the S54's displacement is a constant, the only variable in my formula is the Torque figure (ft/lbs). If we use the published torque of 269 ft/lbs in the above formula (which is = 365Nm as you've given) then we've got:

(150.8 x 269) / 198.083 = 204.78 psi, which is the same as the published BMEP found here: http://www.carfolio.com/specifications/models/car/?car=137973

To convert that figure from psi to Bar, I've used one of the two converters found here: http://www.convertunits.com/from/psig/to/bar
Therefore, it appears that the only difference between our figures is that you have used the first converter to achieve your figure of 14.13 Bar, whereas I've used the second to achieve a figure of 15.13Bar. It seems that difference between us is that you have used a differential scale of pressure, whereas I've used an absolute scale of pressure. Why have you used the differential scale and not the absolute scale? Surely the absolute scale is the correct one to use?
No, there is no difference in the calculations, or the values. The value you have calculated for your car, the value I am quoting is BMW's stock value. There is only one formula, but different units can be used.

Your calculations are based on your observations, as opposed to BMW's quoted values. It has been known for cars to be stronger than the quoted values by a fair margin, but there are a few things to consider when extrapolating values from indirect observations to a derived value:

1. Value for losses - 15% is a reasonable guess for most rear wheel drive vehicles, but this can easily be from 10% to 20% and will vary under different conditions for the same vehicle based on a large number of parameters:
- Tyre choice - µ (friction coefficient) can vary between 0.8 and 1.2 with rolling resistance variations (with a slight speed dependency) from 0.008 to 0.02, depending on tyre compound, temperature, pressure, etc.
- Driveline losses - very dependent on oil, temperature, selected gear (especially between direct drive gears with a 1.00 ratio and any other gear), condition of components (especially differential).
- Road surface texture - affects µ and therefore rolling resistance.
2. Drag variations - the drag coefficient of a given car can vary a lot from the nominal manufacturer's value. Configuration changes such as different wheels, wider tyres (affects the projected cross section), different mirrors, variation in panel gaps,ride height, can easily alter the drag by 10%. At Vmax, a +/-10% drag variation will cause power estimates to vary by +33%/-27%.
3. Environmental variations - easier to estimate, as air density and temperature are fairly well understood in how they affect power output and drag values, but humidity is a bit more of a wild card with both positive and negative affects on given engines. Heat soak of the driveline components can also modify the power to the wheels, as demonstrated by the change seen in repeated dyno runs or hard track day usage.

i'm sure I could think of a lot more variables, but the point is that using a Dash Dyno or a stationary dyno both have pros and cons. I believe that in any case they are useful for comparison of change, as long as the variables mentioned above are kept consistent from test to test. The problem is that neither are very good at giving absolute power outputs, due to the use of "correction factors" that may be arbitrarily assigned. The only really accurate way of measuring engine power is to remove it from the vehicle and run it in an environmentally controlled test cell, together with an accurate air flow that represents both the speed and flow characteristics of the front of the car into the air intake.

With the Dash Dyno, I would push the manufacturer to provide the equations and all input parameters they use, to evaluate their assumptions and limitations. Without that info, basic equations and time-to-distance measurements to compare changes should be at least as accurate, if the test is done in the same gear over the same rev range.
 
Back
Top Bottom