Database of Forum members mapped N20 powered E89s

  • Thread starter Thread starter Anonymous
  • Start date Start date
A

Anonymous

Guest
You can tell its a quiet afternoon in the office..

I've trawled through all the forum members published figures for re-mapped N20 engined E89s and put them together..

You can tell any story you like with numbers as I'm sure some will.

My observations are:

With one exception of the 18i where we do not have a base dyno run the dyno run figures for the OE engines before re-map are remarkably consistent and close to the book figure... the 20i was rated at 184 BHP and the average of that group was 185.6 BHP

An average of 275 BHP and 418 Nm is not too shabby, although some did have a de-cat and a couple had new exhaust systems
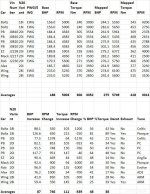
Mapped numbers.jpg
 
Pooltee said:
I did pm the data over to you a while back

I've had to delete my pm folder as it was full, can you resend details pls thnx :thumbsup:
 
Boltz said:
Some good torque achieved by the 28i = 515Nm👍

It does seem good, very good in fact what's going on there? Surely it's got other mods to get to that figure or there's a mistake somewhere.

Just spotted your thread re having the bigger turbo fitted and looking at this and your table in the other thread, I'm being to think you might be on to something with your PWG vs EWG theory. Unless there's other differences between the earlier and later cars we are missing, but Realoem doesn't list any.
 
I was curious about the 28i figures too as it seems to be pretty well agreed that the only evidenced difference that people have been able to find between the models are slightly larger brakes on the 28i

That 28i torque figure is mighty impressive, must be phenomenal when on the move which is where it matters
 
MACK said:
Boltz said:
Some good torque achieved by the 28i = 515Nm👍

It does seem good, very good in fact what's going on there? Surely it's got other mods to get to that figure or there's a mistake somewhere.

Just spotted your thread re having the bigger turbo fitted and looking at this and your table in the other thread, I'm being to think you might be on to something with your PWG vs EWG theory. Unless there's other differences between the earlier and later cars we are missing, but Realoem doesn't list any.

Well the only variables I could find are electronic waste gates vs pneumatic..

Some N20s had low comp pistons but longer duration exhuast camshafts with higher lift, but non were fitted to E89s..

The DME has different part numbers for the 18i 20i 28i and for EWG vs PWG but I assume that's because the base map is different.

Some tuners show an edge for 28i over 20i but then they usually show an edge of 20i over 18i?

The guys had the full decat and exhaust..I'm inclined to suspect its a bit 'exceptional' for spurious reasons..

Obviously if we could get more 28i mapped then that would build confidence in that result..
 
Argyll Andy said:
I was curious about the 28i figures too as it seems to be pretty well agreed that the only evidenced difference that people have been able to find between the models are slightly larger brakes on the 28i

That 28i torque figure is mighty impressive, must be phenomenal when on the move which is where it matters

Yes its exceptional, although it does fall off much more rapidly compared to other re-maps...but the peak is the best..as discussed would like to see some more 28i re-maps to build confidence /undertstand those numbers..
 
Pbondar said:
Argyll Andy said:
I was curious about the 28i figures too as it seems to be pretty well agreed that the only evidenced difference that people have been able to find between the models are slightly larger brakes on the 28i

That 28i torque figure is mighty impressive, must be phenomenal when on the move which is where it matters

Yes its exceptional, although it does fall off much more rapidly compared to other re-maps...but the peak is the best..as discussed would like to see some more 28i re-maps to build confidence /undertstand those numbers..

It is a huge figure but as you allude to, it's more peaky. Still wads of torque either side so probably not noticeable in reality.
Yet again I look at your chart and see that my torque gain seems pretty low compared to others. I would like to drive one or two of them to see how much difference that makes. In mitigation though, mine seemed to start with a pretty high base figure, so if you calculated % increase from that it will appear a tiny bit lower. What's important for my driving though is that the Nm figure remains within 2 or 3 of that peak figure, from as low as 1900 rpm. So I can be lazier with the shifting and still whizz along.
Just annoys me that it stands out so much on your chart. :headbang:
But, although others will have to take my word for it, it does highlight that bald figures aren't everything.
 
enuff_zed said:
Pbondar said:
Argyll Andy said:
I was curious about the 28i figures too as it seems to be pretty well agreed that the only evidenced difference that people have been able to find between the models are slightly larger brakes on the 28i

That 28i torque figure is mighty impressive, must be phenomenal when on the move which is where it matters

Yes its exceptional, although it does fall off much more rapidly compared to other re-maps...but the peak is the best..as discussed would like to see some more 28i re-maps to build confidence /undertstand those numbers..

It is a huge figure but as you allude to, it's more peaky. Still wads of torque either side so probably not noticeable in reality.
Yet again I look at your chart and see that my torque gain seems pretty low compared to others. I would like to drive one or two of them to see how much difference that makes. In mitigation though, mine seemed to start with a pretty high base figure, so if you calculated % increase from that it will appear a tiny bit lower. What's important for my driving though is that the Nm figure remains within 2 or 3 of that peak figure, from as low as 1900 rpm. So I can be lazier with the shifting and still whizz along.
Just annoys me that it stands out so much on your chart. :headbang:
But, although others will have to take my word for it, it does highlight that bald figures aren't everything.

For most people driving most of the time its the area under the torque curve that matters and the sooner it arrives the better..

As you say just being able to boot it and go is great..

I've struggled to find a program that allows you to plug in torque as well as bhp figures to compute acceleration..

Clearly an engine that delivers lots of torque over a large rpm range must be better accelerating than an engine that reaches a similar torque figure but is peakier and places that torque higher up..

My Volvo XC70 and SWMBO Mini both turbo diesels may not have the highest BHP but the torque is very strong 490 nm and 360 nm around 2,200 rpm and they are both great overtakers
 
I wouldn't get too hung up on torque. Dyno torque figures are notoriously inaccurate when it comes to torque. The biggest problem with dyno operators seems to be getting the correct gearing entered as there's variation between transmission and also the issue of people having oversized wheels/tyres with larger diameters.

Good little PDF on the issue with dyno torque here: https://mainlinedyno.com.au/images/downloads/DYNO_TORQUE_FIGURES_-_THE_TRUTH.pdf

If you're solely interested in comparing the power output of different maps on identical cars then you ideally you want each person to show what their boost pressure, timing and fuel ratio area. These parameters can be quite easily logged with things like TestO and Bimmergeeks Protool.

For comparison with other models a device like Dragy is a good way of measuring output for comparison.
 
R.E92 said:
I wouldn't get too hung up on torque. Dyno torque figures are notoriously inaccurate when it comes to torque. The biggest problem with dyno operators seems to be getting the correct gearing entered as there's variation between transmission and also the issue of people having oversized wheels/tyres with larger diameters.

Good little PDF on the issue with dyno torque here: https://mainlinedyno.com.au/images/downloads/DYNO_TORQUE_FIGURES_-_THE_TRUTH.pdf

If you're solely interested in comparing the power output of different maps on identical cars then you ideally you want each person to show what their boost pressure, timing and fuel ratio area. These parameters can be quite easily logged with things like TestO and Bimmergeeks Protool.

For comparison with other models a device like Dragy is a good way of measuring output for comparison.

Fair enough.
To be honest, I think BHP & NM are not as accurate an indicator as either SOP or SPM.

Seat Of Pants
Smiles Per Mile
 
enuff_zed said:
R.E92 said:
I wouldn't get too hung up on torque. Dyno torque figures are notoriously inaccurate when it comes to torque. The biggest problem with dyno operators seems to be getting the correct gearing entered as there's variation between transmission and also the issue of people having oversized wheels/tyres with larger diameters.

Good little PDF on the issue with dyno torque here: https://mainlinedyno.com.au/images/downloads/DYNO_TORQUE_FIGURES_-_THE_TRUTH.pdf

If you're solely interested in comparing the power output of different maps on identical cars then you ideally you want each person to show what their boost pressure, timing and fuel ratio area. These parameters can be quite easily logged with things like TestO and Bimmergeeks Protool.

For comparison with other models a device like Dragy is a good way of measuring output for comparison.

Fair enough.
To be honest, I think BHP & NM are not as accurate an indicator as either SOP or SPM.

Seat Of Pants
Smiles Per Mile

Yet if you look at Petes experience with his original map it took a dyno run to pick out the gaping hole in the power delivery.
It wasn’t picked up at the time as the car wasn’t rolling road tested :thumbsup:
Rob
 
Smartbear said:
enuff_zed said:
R.E92 said:
I wouldn't get too hung up on torque. Dyno torque figures are notoriously inaccurate when it comes to torque. The biggest problem with dyno operators seems to be getting the correct gearing entered as there's variation between transmission and also the issue of people having oversized wheels/tyres with larger diameters.

Good little PDF on the issue with dyno torque here: https://mainlinedyno.com.au/images/downloads/DYNO_TORQUE_FIGURES_-_THE_TRUTH.pdf

If you're solely interested in comparing the power output of different maps on identical cars then you ideally you want each person to show what their boost pressure, timing and fuel ratio area. These parameters can be quite easily logged with things like TestO and Bimmergeeks Protool.

For comparison with other models a device like Dragy is a good way of measuring output for comparison.

Fair enough.
To be honest, I think BHP & NM are not as accurate an indicator as either SOP or SPM.

Seat Of Pants
Smiles Per Mile

Yet if you look at Petes experience with his original map it took a dyno run to pick out the gaping hole in the power delivery.
It wasn’t picked up at the time as the car wasn’t rolling road tested :thumbsup:
Rob

Well I did get a dyno run.
It goes straight up to 360NM by 1900 rpm and sits almost level until 5500 or so.
My gripe when I look at the bare bones of Pete's chart is that my torque figures look way lower than others, even taking into account the differences between rolling roads. However, I feel on the road that the car is fine and dandy to hustle along. If the graph did a cheeky little blip up to 400+, somewhere around the 4500rpm mark it would look a whole lot better on the chart, but in fact, on the road, would be next to no different.
It all just goes to show that, as Pete has emphasised many times in his informed discussions on this subject, figures on a piece of paper can be read as many different ways as there are people to read them.

But I guess Rob, you'll be used to just seeing the 'bear' facts. :wink:
 
I was just about to say what Rob already has. The old butt dyno can be misleading, a lot of it is power delivery. I've driven plenty of fast diesels and certainly appreciate the feeling of speed they give, much like electric cars, but the speedo doesn't lie. One of the things that struck me about the new 911 Turbo was how quick the speedo went up even though it felt slower than a 335d.

It's actually not so great for a car to feel fast if you value traction. I've been through countless tune revisions on my car and it's quite easy to make the car feel rabid and ready to kick the rear out but it's much more useful to have the torque come on in a controlled manner so that the car loads up the rear and grips rather than just spinning up.
 
Well to integrate all the inputs..

In a perfect world everyone would do a before and after dyno run and we would amass a great database...plus R.E92 point on a data logger would be good..

I may treat myself to one and then lure unsuspecting 30i E89 owners into running a few timed runs.. :rofl:

Trying to find a quiet straight road around here without inclines is a bit problematic..

I think the before and after graph is very useful as you can ‘see’ the holes and also within limits compare different engines and their outputs..
 
Pbondar said:
Trying to find a quiet straight road around here without inclines is a bit problematic..

Nip to Norfolk then. Definitely no inclines (though my pushbike tells me different) and plenty of quiet straight roads.
But leave it until February now, as the sugar beet 'campaign' has started and hitting one of the many that fall off the trailers will undoubtedly spoil your day!
 
Back
Top Bottom